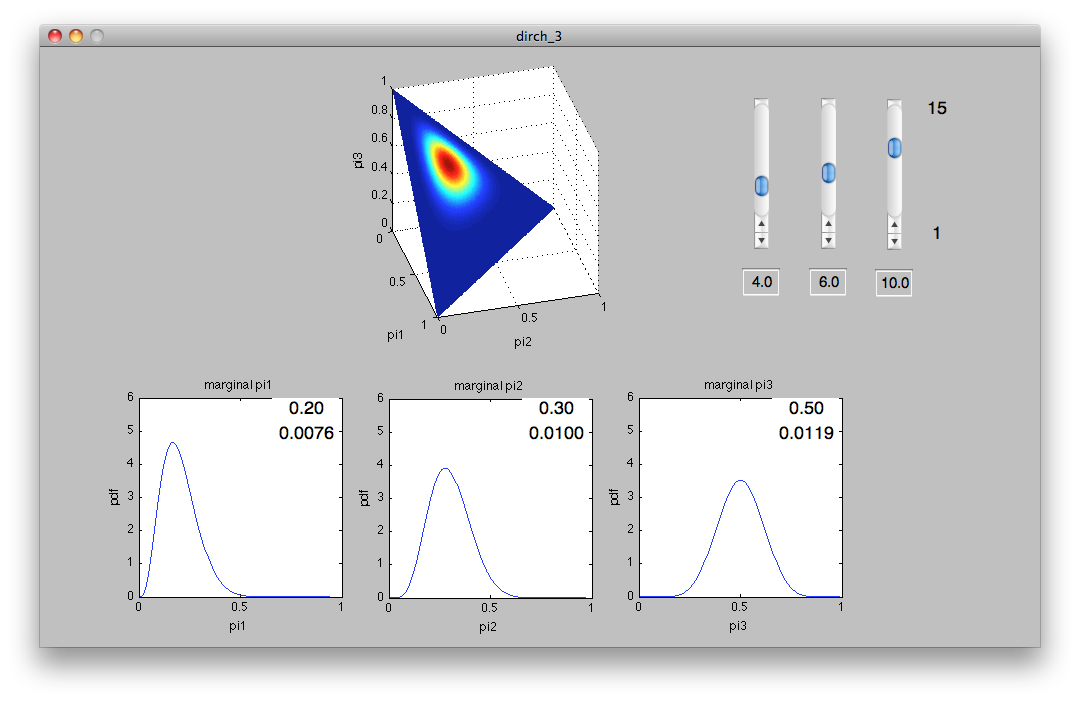
In order to help the graduate students visualize the Dirichlet Process, I made a widget in Matlab that plots the joint PDF of a third order Dirichlet Process. The density is colormapped onto a three dimensional representation of the sample space, which for this case is the plane x+y+z=1, confined to the first quadrant.
A third order Dirichlet Process deals with a random process that has three discrete outcomes, but the probabilities for those outcomes are unknown. The Dirichlet Process quantifies the possible spread of probabilities for the outcomes. Note that each of the three unknown probabilities x, y, and z have to be between 0 and 1, and that x + y + z = 1 (because the sum of probabilities in a sample space always equals one).
You can download the widget (including another version for the 2nd order Dirichlet Process) by clicking here. From within Matlab, just run "dirch_3" or "dirch_2". The smaller plots at the bottom show the marginal densities for the individual variables.
No comments:
Post a Comment